
NC is getting trashed · Solid waste & clean water
Waste doesn’t disappear at the curb.
What we throw away connects landfill space, public costs, recycling, groundwater, rivers, and coastal fisheries.
Coastal Carolina Riverwatch’s assessment looks at North Carolina’s waste system from 1994 to 2026—and the choices that can protect its future.
Explore the findingsFind your next step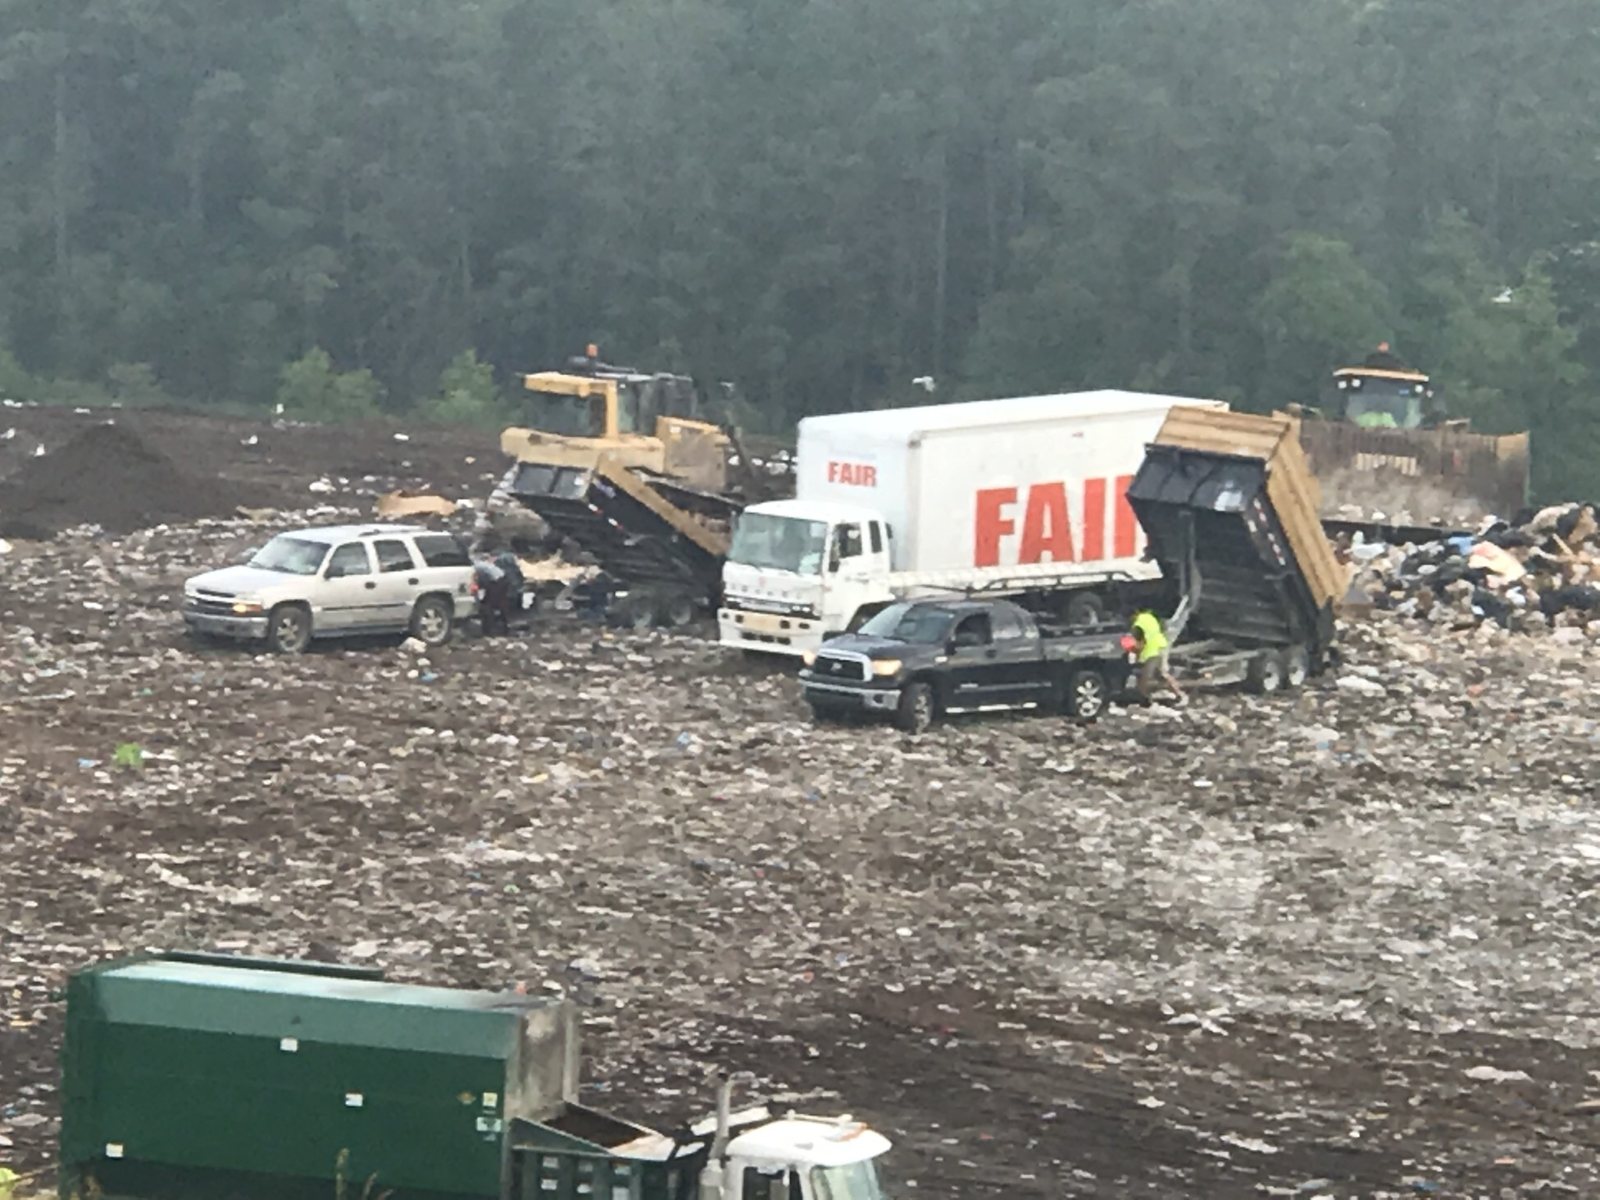
The statewide picture
Stronger engineering. More waste. Unfinished work.
North Carolina moved from many older disposal sites toward fewer, engineered landfills and a regional network of transfer stations. Liners, leachate collection, and monitoring improved environmental controls. Those improvements also left communities more dependent on transportation, contracts, constructed capacity, and long-term care.
The next question is how to reduce the demand for disposal, recover useful materials, and follow contaminants through the whole system.
These indicators describe different things. Disposal tonnage includes municipal solid waste (MSW) and construction and demolition (C&D) waste; the capacity estimate concerns MSW landfills. Hurricane Helene increased FY 2024–25 disposal. The waste study sampled three facilities across several seasons; it is a planning snapshot, not a census of every household.
Why this belongs in Water Quality for Fisheries
Solid waste connects the fishing community’s concerns about plastic pollution, industrial contaminants, and wastewater. Preventing waste and tracing pollution pathways help connect research with education, policy, and infrastructure solutions.
Materials have another life
Much of what gets buried has recovery potential.
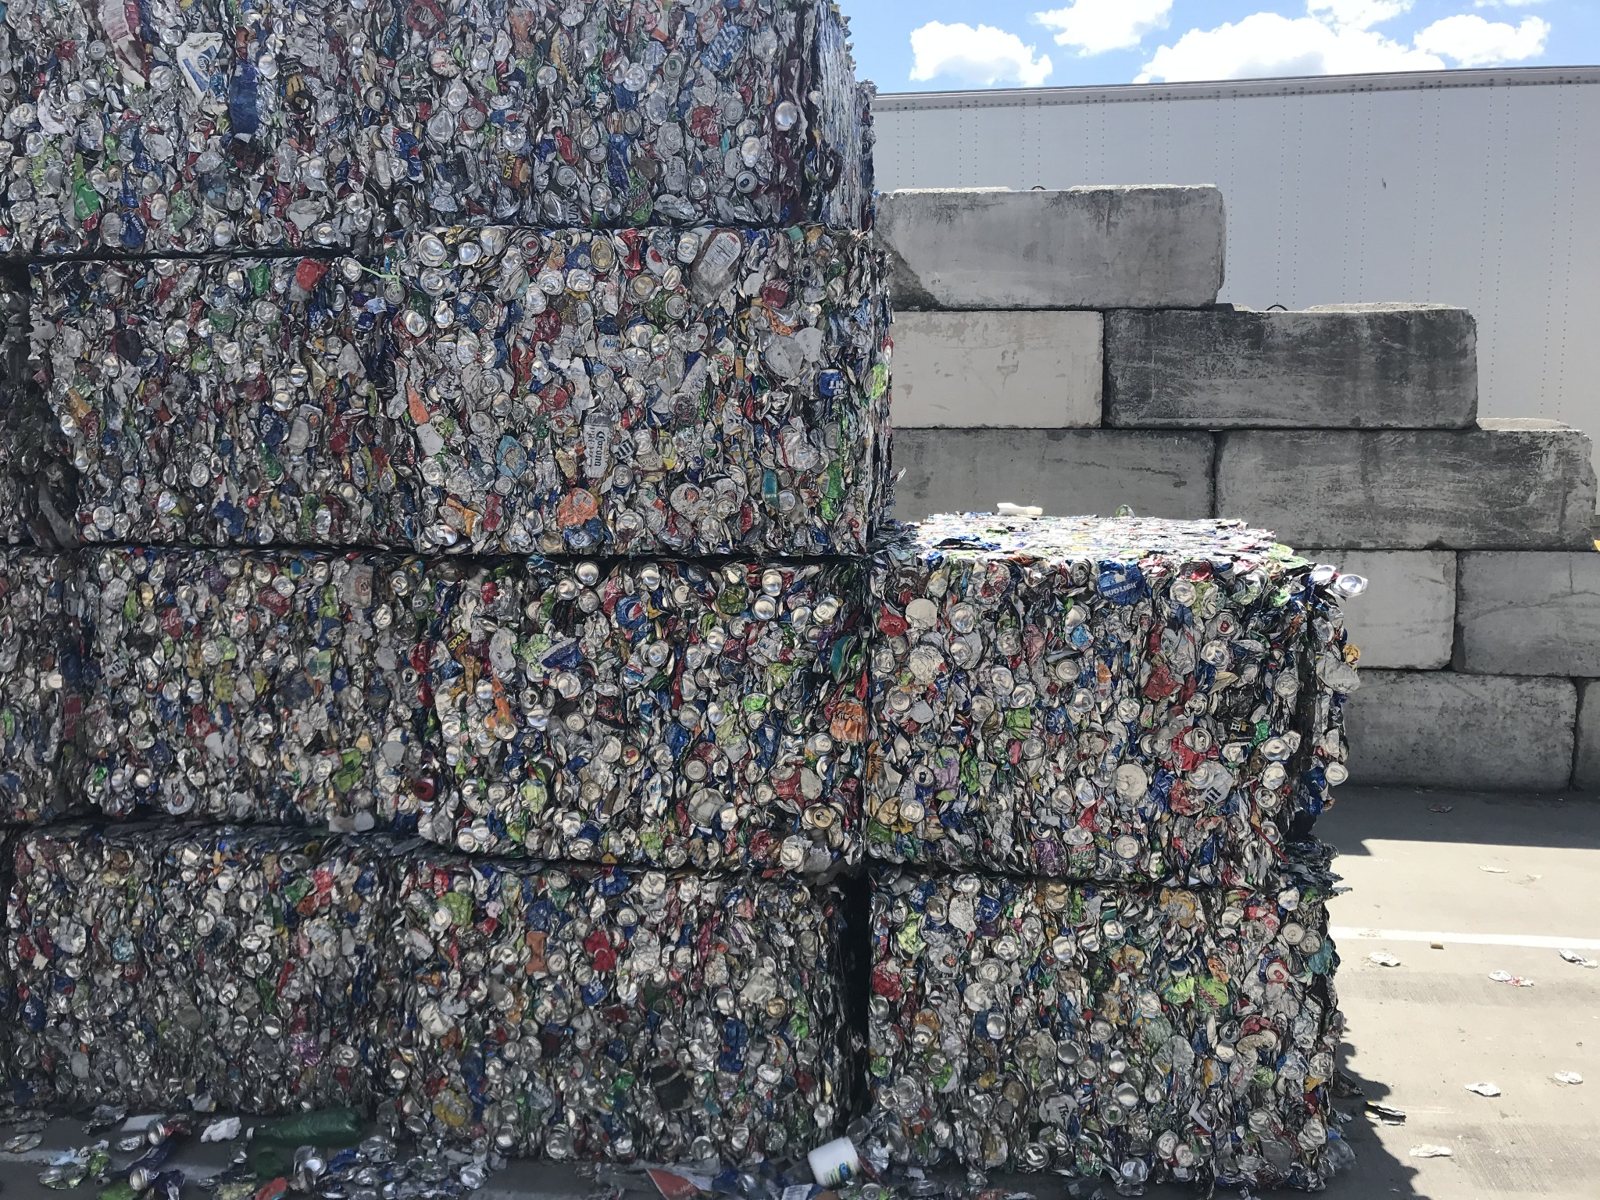
The 2025 waste sort identified recyclable paper, containers, other recoverable materials, and organics still being discarded. Its 67% finding describes potential recovery through recycling or composting pathways; it does not promise that every community already has convenient access or that all material can be captured.
Food made up about 22.1% of the overall sampled stream. Prevention, food donation where appropriate, and organics processing address a different part of the system than container recycling.
Not everything classified as recyclable belongs in a curbside cart. Batteries, electronics, film, and other special materials may require separate collection. Always follow the receiving program’s instructions.
| Material-management category | Pounds out of 100 |
|---|---|
| Recyclable paper | 11.0 |
| Recyclable containers | 9.8 |
| Other recyclables | 17.0 |
| Potentially recyclable materials | 7.4 |
| Compostable materials | 29.9 |
| Landfill category | 24.9 |
These are the residential sample’s weight percentages expressed as pounds in a hypothetical 100-pound sample. They are not an estimate of an individual’s trash generation, and they differ from the study’s combined residential/commercial findings.
What has to work for recovery to succeed?
- Access: collection or drop-off that people can realistically use.
- Quality: clear sorting instructions and less contamination.
- Processing: equipment, staff, and safe storage for each material.
- Markets: reliable buyers and demand for recovered feedstocks.
- Feedback: public reporting on what was collected, rejected, and actually recovered.
Landfill space is infrastructure
Permitted space is only the first question.
The state’s FY 2024–25 report estimated 20.9 years of remaining permitted MSW capacity at that year’s disposal rate, or 27.3 years using facilities’ lifetime-average rates. These are scenarios, not a statewide closing date. [1]
Permitted
Legally approved airspace. Some of it may not yet be built.
Constructed
Cells and systems physically ready for disposal.
Accessible
Capacity a community can use under service areas, contracts, distance, and price.
Resilient
Usable alternatives when storms, road closures, or operating disruptions interrupt the routine route.
A ton is not a cubic yard.
Weight measures material mass. Cubic yards measure space. Different materials compact differently, so a capacity-preservation goal needs direct airspace measurements alongside tonnage, recovery, climate, toxicity, and cost indicators.
Questions residents and local officials can ask
- How much capacity is permitted, and how much is already constructed?
- Which jurisdictions are allowed to use it?
- What is the next expansion cost and construction schedule?
- Where does waste go if the normal facility or route is unavailable?
- How are disaster debris, imported waste, and cover material reported?
- How much airspace did prevention and recovery preserve?
From discarded products to receiving waters
Waste management is water management.
Leachate is water that has contacted waste and picked up dissolved or suspended contaminants. Collecting it is important, but collection alone does not destroy persistent chemicals. The destination and treatment pathway matter.
Products & waste
Discarded products can contain plastics, additives, PFAS, and other chemicals.
Collection & disposal
Waste may be contained in engineered systems or become litter, illegal dumping, or legacy-site material.
Transport pathways
Leachate, groundwater, runoff, and wastewater can move contaminants through different routes.
Downstream questions
Monitoring helps evaluate receiving waters, private wells, aquatic habitat, and potential exposures.
This is a conceptual pathway, not evidence that a particular landfill caused contamination in a particular river, well, or seafood sample. Source attribution requires site-specific chemistry, flow, mass loads, hydrology, and other sources.
PFAS & leachate
NCDEQ’s March 2023 directive requires sanitary landfills to include PFAS analyses in regular groundwater, surface-water, and leachate sampling. [3] Conventional wastewater treatment generally does not destroy PFAS; some compounds may move into effluent, biosolids, or other residuals. Treatment performance must be evaluated for the actual chemicals and systems involved.
A useful public record would link landfill results and leachate flow with the receiving treatment plant, its discharge permit, residuals management, and nearby receptors.
Legacy landfills
The July 2026 State Auditor report found 534 of 688 pre-regulatory sites were not actively monitored as of June 30, 2025. That is 78% of the inventory. The finding describes program status, not proof that every site has the same contamination or risk. [4]
Investigation, access, funding, and clear communication remain important where older disposal areas overlap with present-day communities and waterways.
Connect the research without overstating it.
CCRW’s microplastics work, plastic-chemical research, PFAS monitoring, and oyster research help inform downstream questions. These projects do not establish landfill source attribution.
The gate fee is not the whole bill
We pay to bury materials that still have value.
NCDEQ’s economic analysis estimated that about 2 million tons of selected recyclables were disposed of in 2025. It assigned those materials more than $372 million in estimated material value and estimated $104 million in landfill tipping fees. [5]
Material value and tipping fees are different economic measures. They should not be added together as a single cost or presented as guaranteed recoverable revenue.
Visible costs
Collection, hauling, transfer, and disposal fees.
Long-term costs
Expansion, closure, post-closure care, environmental monitoring, and corrective action.
Shared costs
Litter cleanup, truck traffic, disaster response, and public responsibilities where older sites remain unresolved.
What should a bottle-bill cost analysis include?
A deposit-return system should be evaluated across the whole system: redemption operations, retailer space and equipment, transport, administration, rural access, consumer time, recovered material, and changes to existing recycling contracts.
A refundable deposit is a transfer that can be returned to the consumer. It is not the same thing as the resource cost of running the program. Avoided tipping fees also do not equal net public savings when fixed costs, handling expenses, or lost material revenue remain.
The assessment’s beverage-container recovery scenarios are planning models based partly on other states’ data. They are not measured North Carolina sales or a completed benefit-cost analysis.
Three decades of change
What changed—and what needs to change next.
| Period | System change | Continuing question |
|---|---|---|
| 1989–1991 | State waste-management framework and a 40% per-capita reduction goal. | Targets need implementation, infrastructure, and credible measurement. |
| 1990s–1998 | Transition toward lined MSW landfills with leachate collection. | How are contaminants managed after collection? |
| 2000s onward | Regional disposal, transfer stations, and stronger long-term financial responsibilities. | Who can access capacity, at what cost, and with what backup? |
| 2023 onward | Expanded PFAS sampling in sanitary landfill monitoring. | Can the public follow results through disposal and water systems? |
| 2026 | New waste-characterization findings and legacy-landfill audit. | How will evidence translate into recovery, cleanup, and accountability? |
Why revisit the statewide reduction goal?
The assessment found that the former 40%-by-2001 per-capita target was not achieved, while targeted programs such as yard-waste diversion did preserve disposal capacity. It recommends pairing any future goal with funded infrastructure, access, material-specific programs, and clear reporting.
For capacity planning, the proposed measurement framework tracks resident-generated MSW airspace per person and in total, with a separate C&D series and explicit treatment of imports, exports, disaster debris, and operational cover. The percentages explored in the assessment are illustrative options, not adopted statewide requirements.
Research → education → policy → implementation
Different tools solve different parts of the problem.
The assessment examines the following options for public discussion and further analysis. Listing an option does not mean North Carolina has adopted it or that it will deliver the same outcome everywhere.
Prevent food waste and expand organics recovery
Prioritize prevention and edible-food recovery, then match composting or digestion with collection, processing capacity, contamination controls, and end uses. Track actual diversion and outcomes.
Evaluate deposit-return and producer responsibility
Examine who finances collection and recovery, how rural and urban access differ, how existing recycling contracts change, and what sales and recovery data are needed. Measure litter and recovery rather than assuming a fixed reduction.
Read the official H344 bill record and current status. A bill proposal is not an enacted program.
Use pricing carefully
Variable-rate or pay-as-you-throw systems can create incentives to reduce disposal. Local designs need affordable access, low-income protections, practical rural service, and safeguards against illegal dumping.
Recover construction materials, textiles, and bulky items
Deconstruction, salvage, repair, clean-material separation, and dedicated recovery markets can address streams that ordinary curbside collection does not. Keep C&D measures separate from household waste comparisons.
Match material restrictions with real collection options
Disposal bans need convenient collection, education, processing capacity, markets, and enforcement. Bag and expanded-polystyrene measures need North Carolina-specific analysis before assigning tonnage or litter-reduction estimates.
Make permitting, monitoring, and enforcement visible
Connect permit milestones, inspections, violations, corrective actions, monitoring results, leachate destinations, and nearby receptors. Include closure and post-closure obligations and cumulative community burdens in the public discussion.
A public dashboard should answer useful questions.
How much airspace did disposal use? What capacity can each region actually access? Which materials were recovered? Where does leachate go? Which legacy sites have been investigated? What corrective actions are complete?
This is a proposed reporting framework. The figures on this page are dated report findings, not a live facility-monitoring feed.
Choose one useful next step
What can you do?
Residents
- Check your local program’s accepted materials before sorting.
- Plan meals, use leftovers, and prevent avoidable food waste.
- Contain litter and keep bins from overflowing.
- Use designated collection for rechargeable batteries and other special materials.
Businesses & institutions
- Measure what your operation discards.
- Reduce unnecessary packaging and establish reuse systems.
- Keep recoverable material clean and confirm a receiving market.
- Explore food donation, organics recovery, and staff training.
Local governments
- Assess constructed and accessible capacity, including disaster contingencies.
- Publish recovery, contamination, and full-cost information.
- Map service gaps and special-material needs.
- Connect solid-waste planning with stormwater, wastewater, and watershed protection.
Battery update: December 1, 2026
North Carolina’s lithium-ion battery disposal ban takes effect December 1, 2026. Rechargeable batteries should go to designated drop-off locations, not trash or curbside recycling carts. Follow the receiving program’s handling instructions. [6]
Field experience & shared learning
Connect the evidence with the people who can use it.
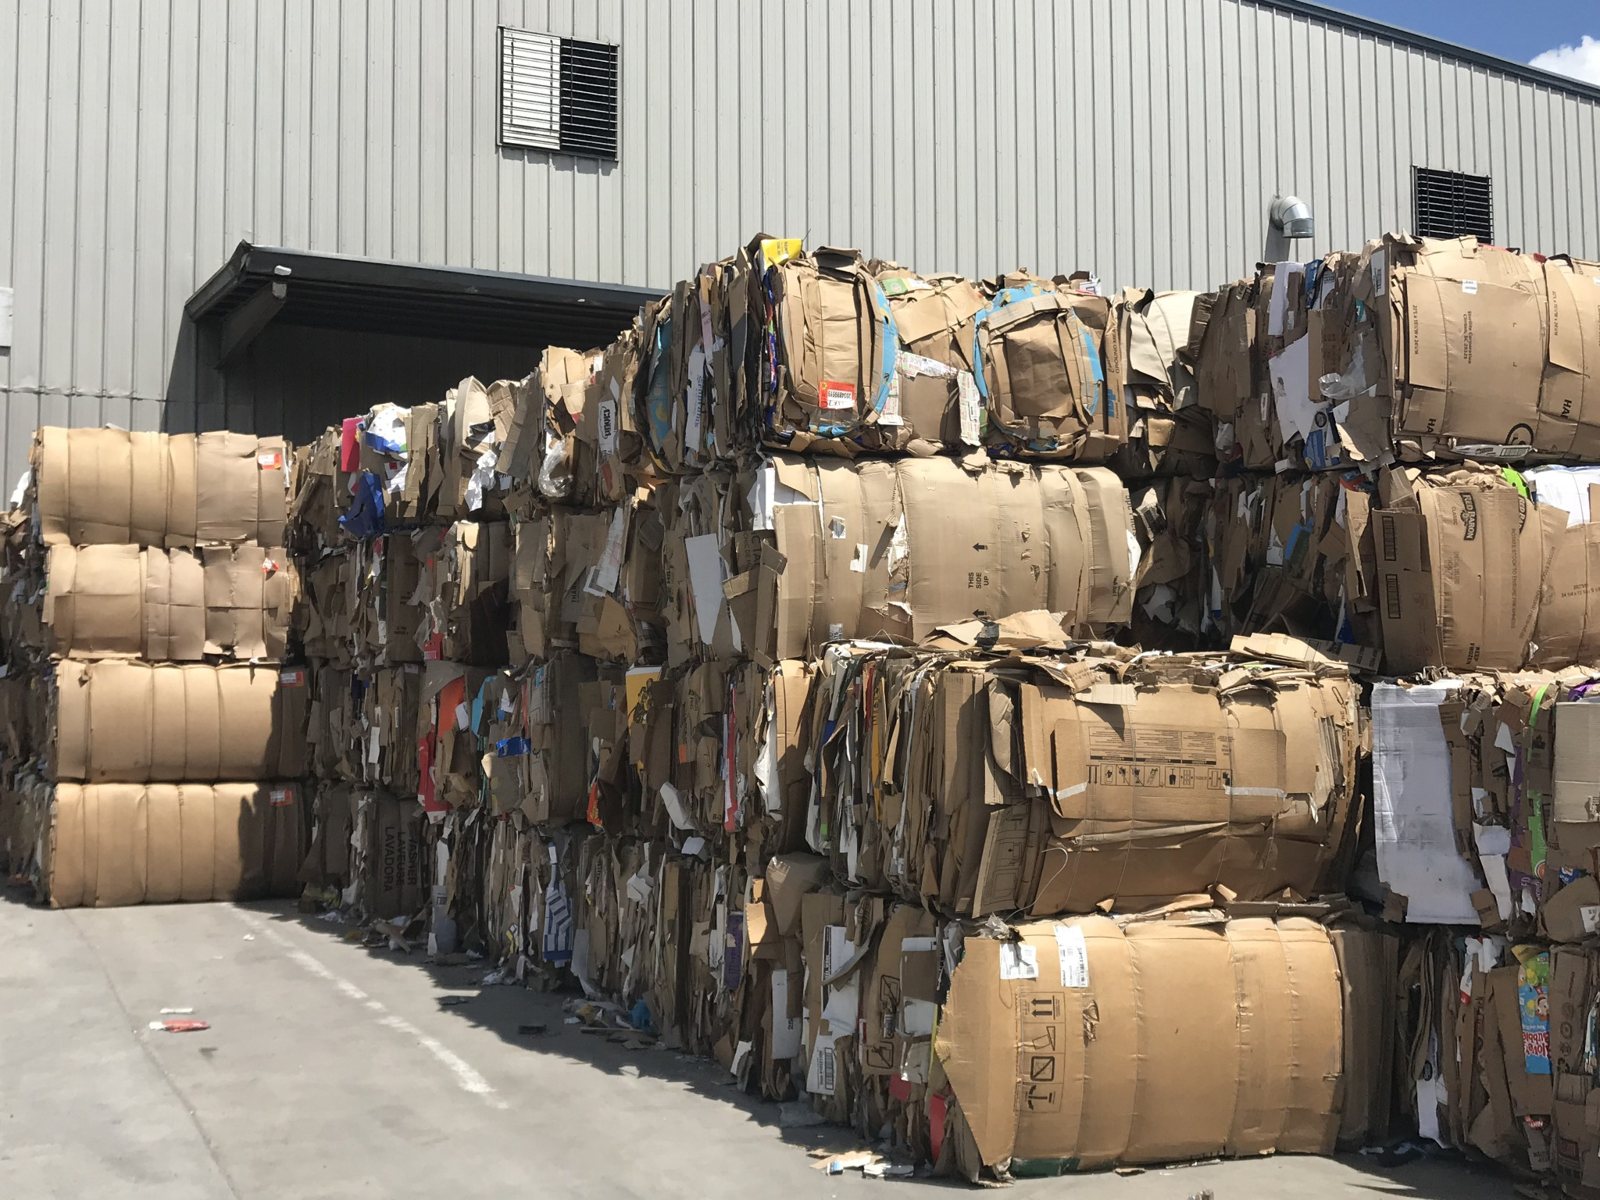
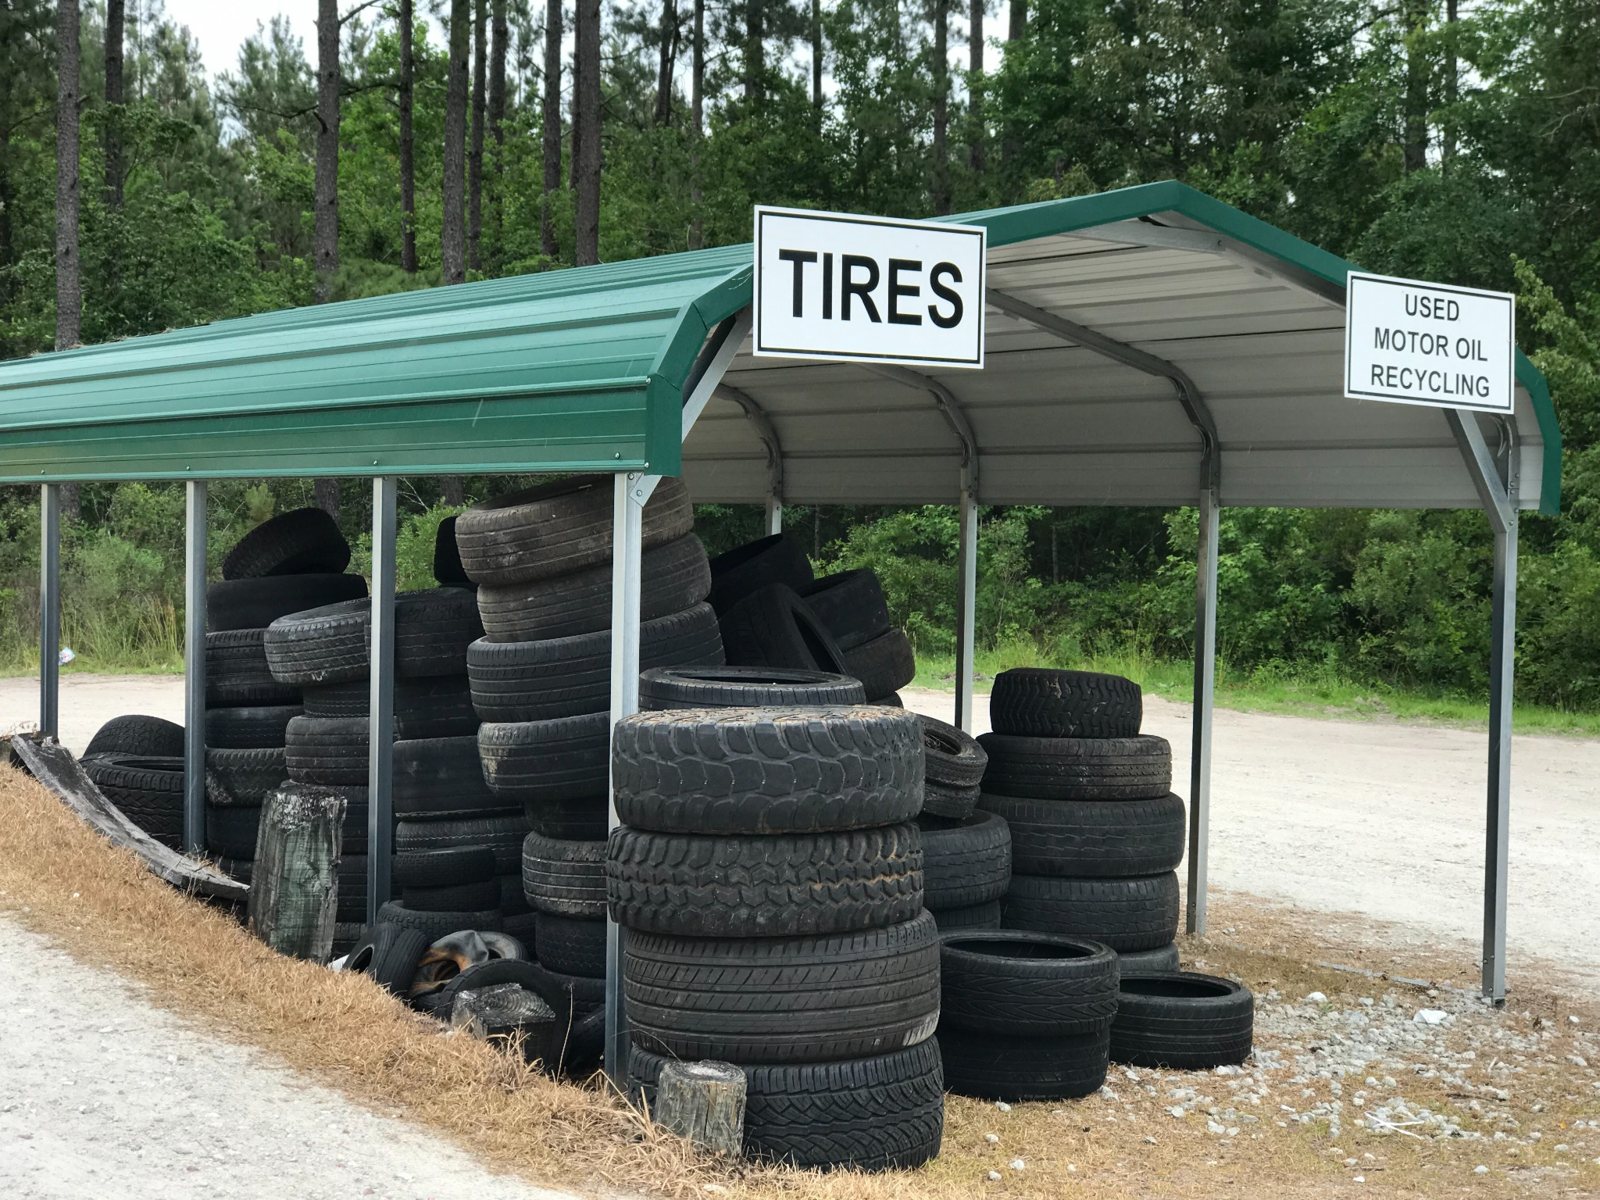
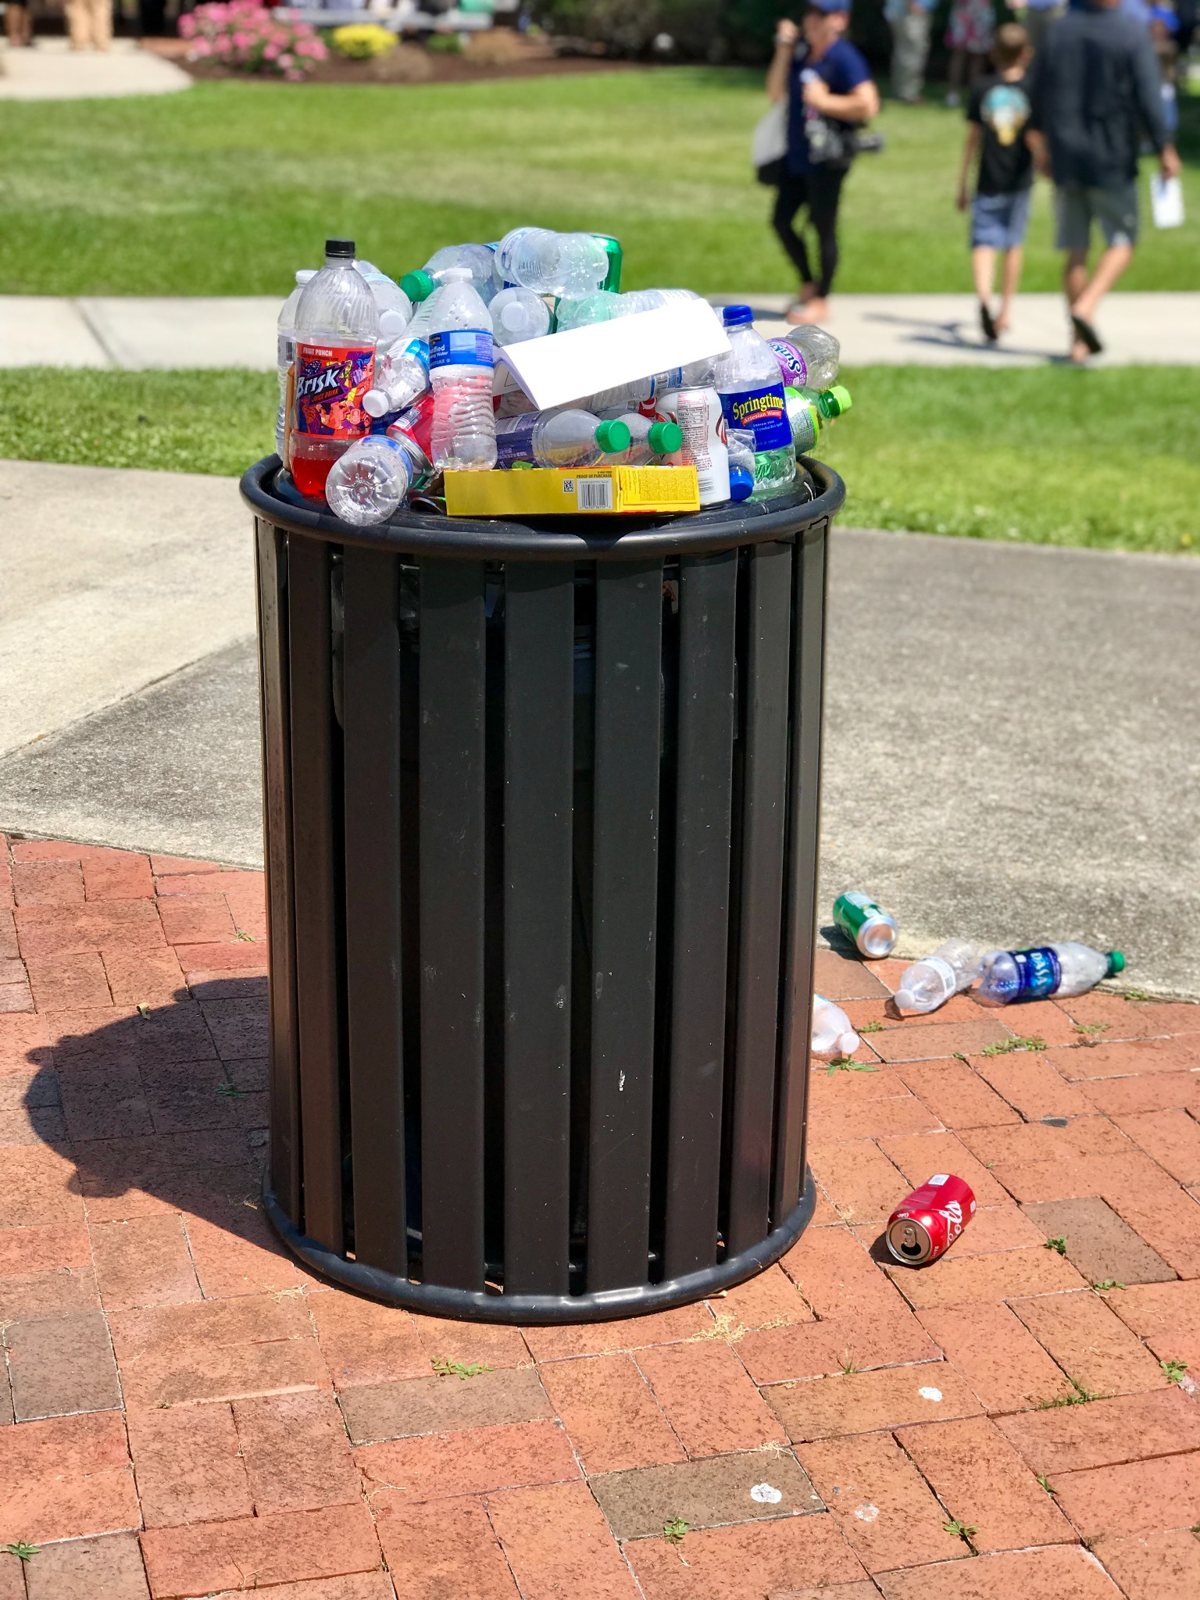
Research becomes more useful when residents, fishermen, operators, educators, researchers, and public officials can discuss what it means and what to do next. The supplied photographs show material recovery, community education, and public discussion—the connections this work seeks to strengthen.
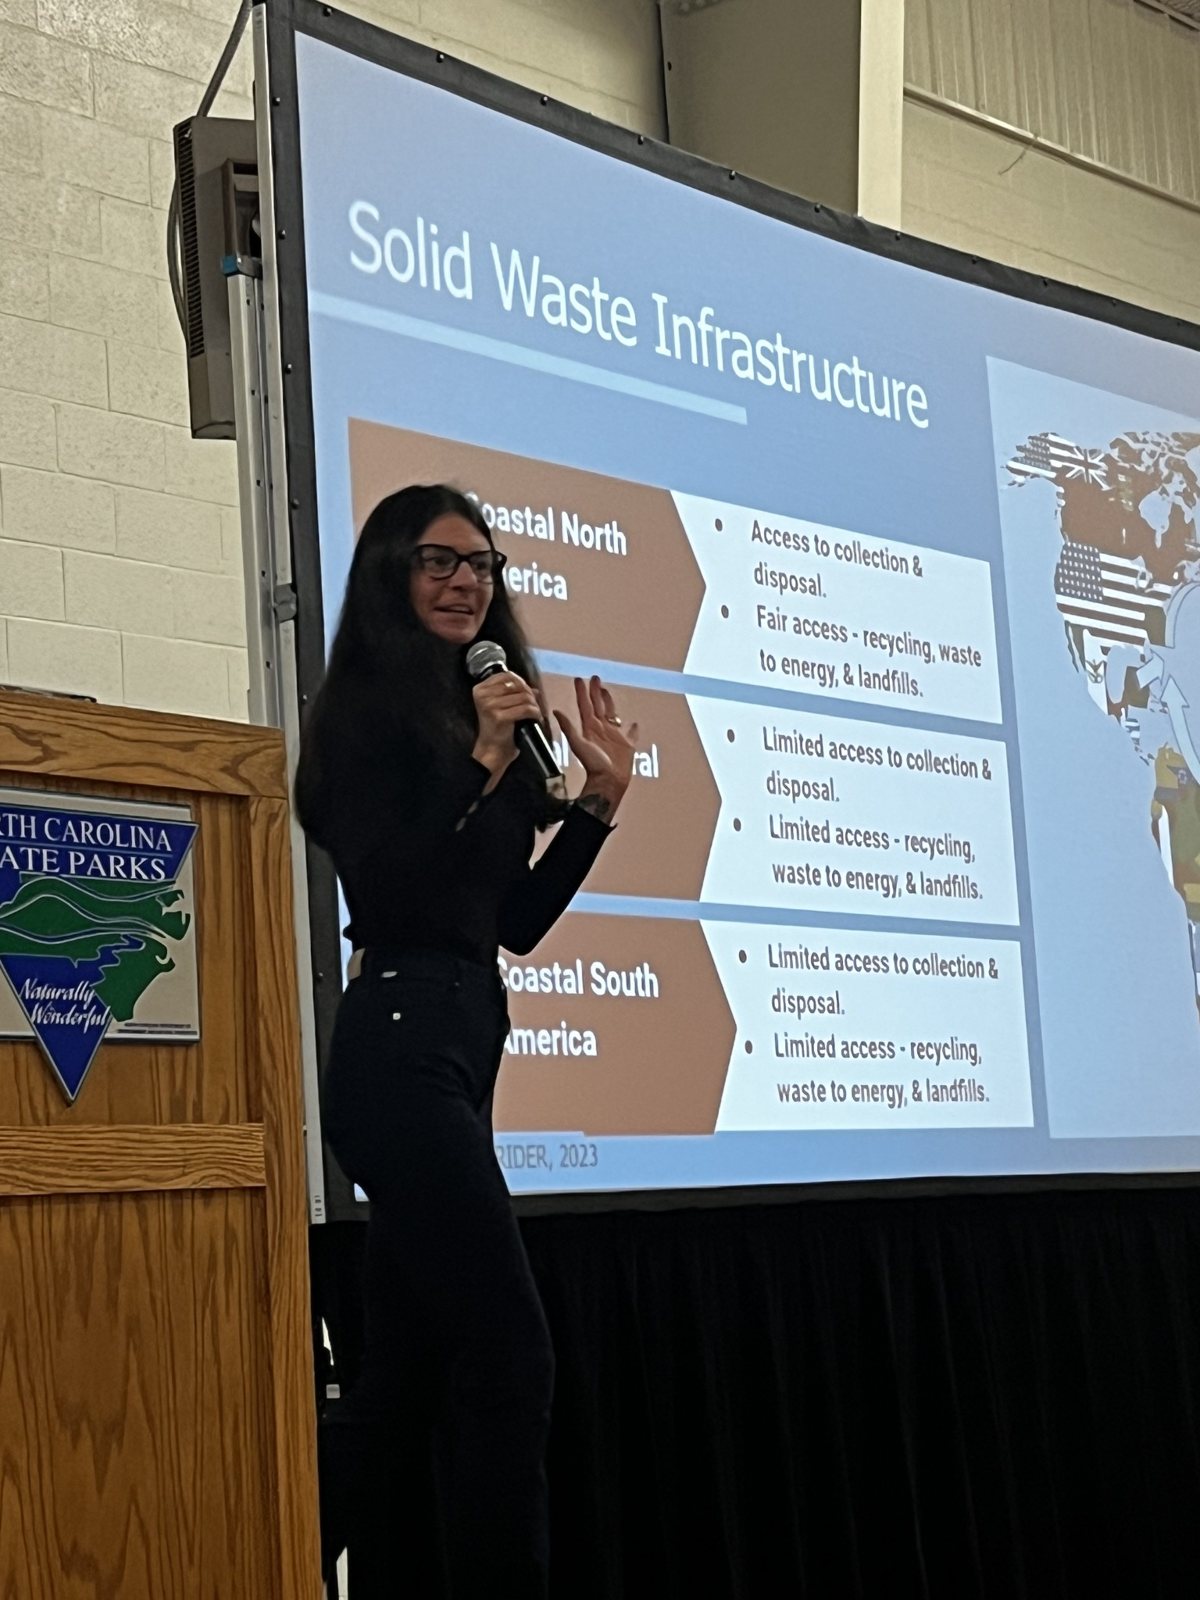
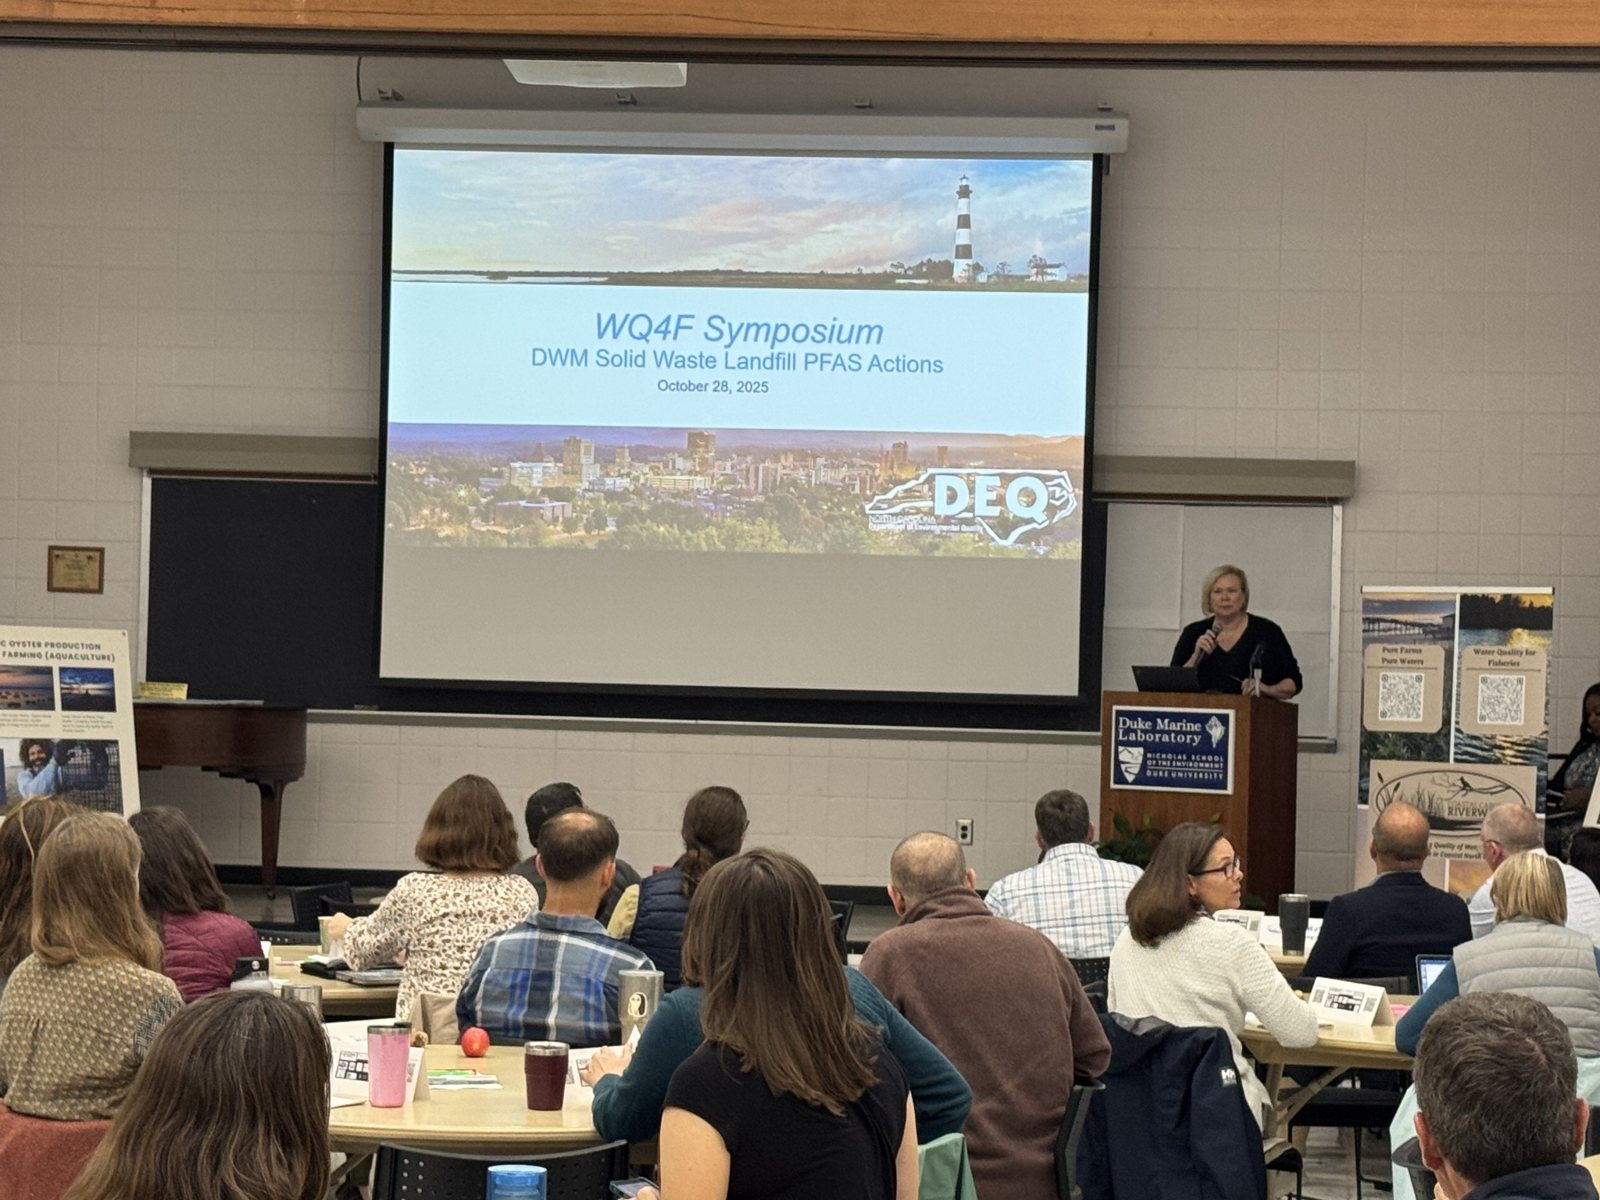
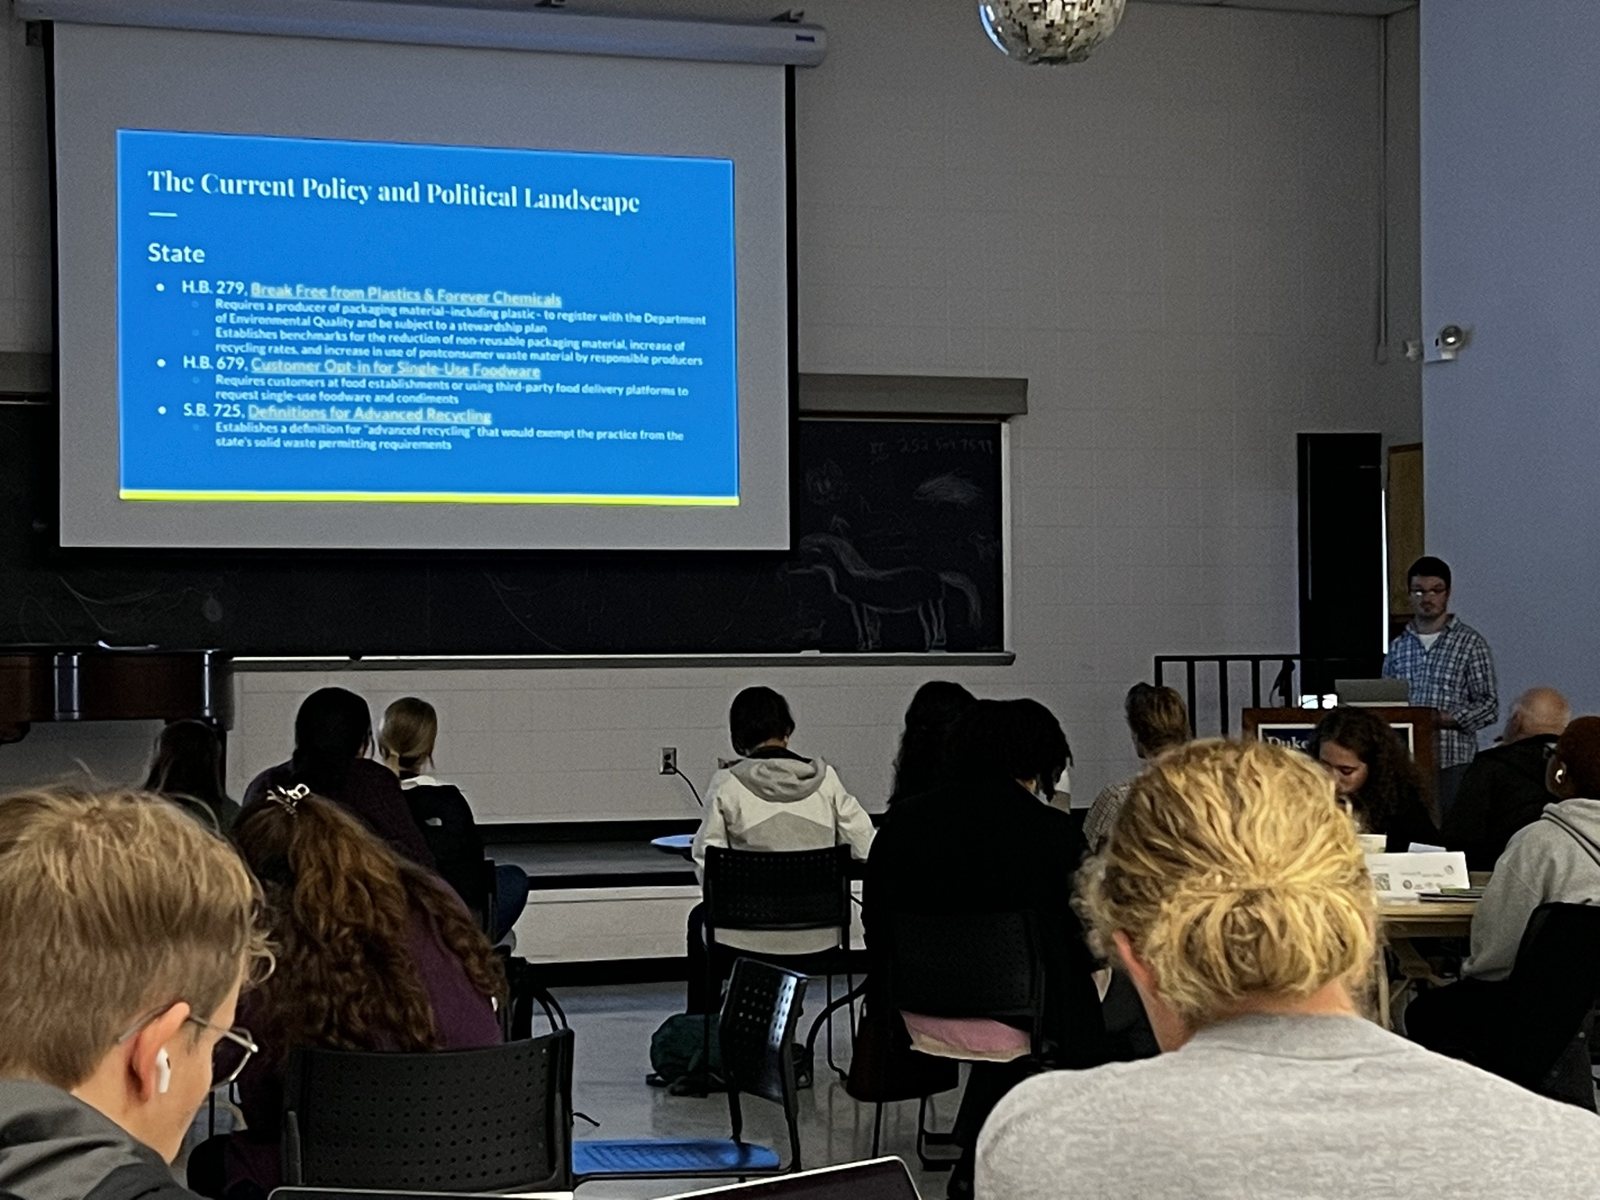
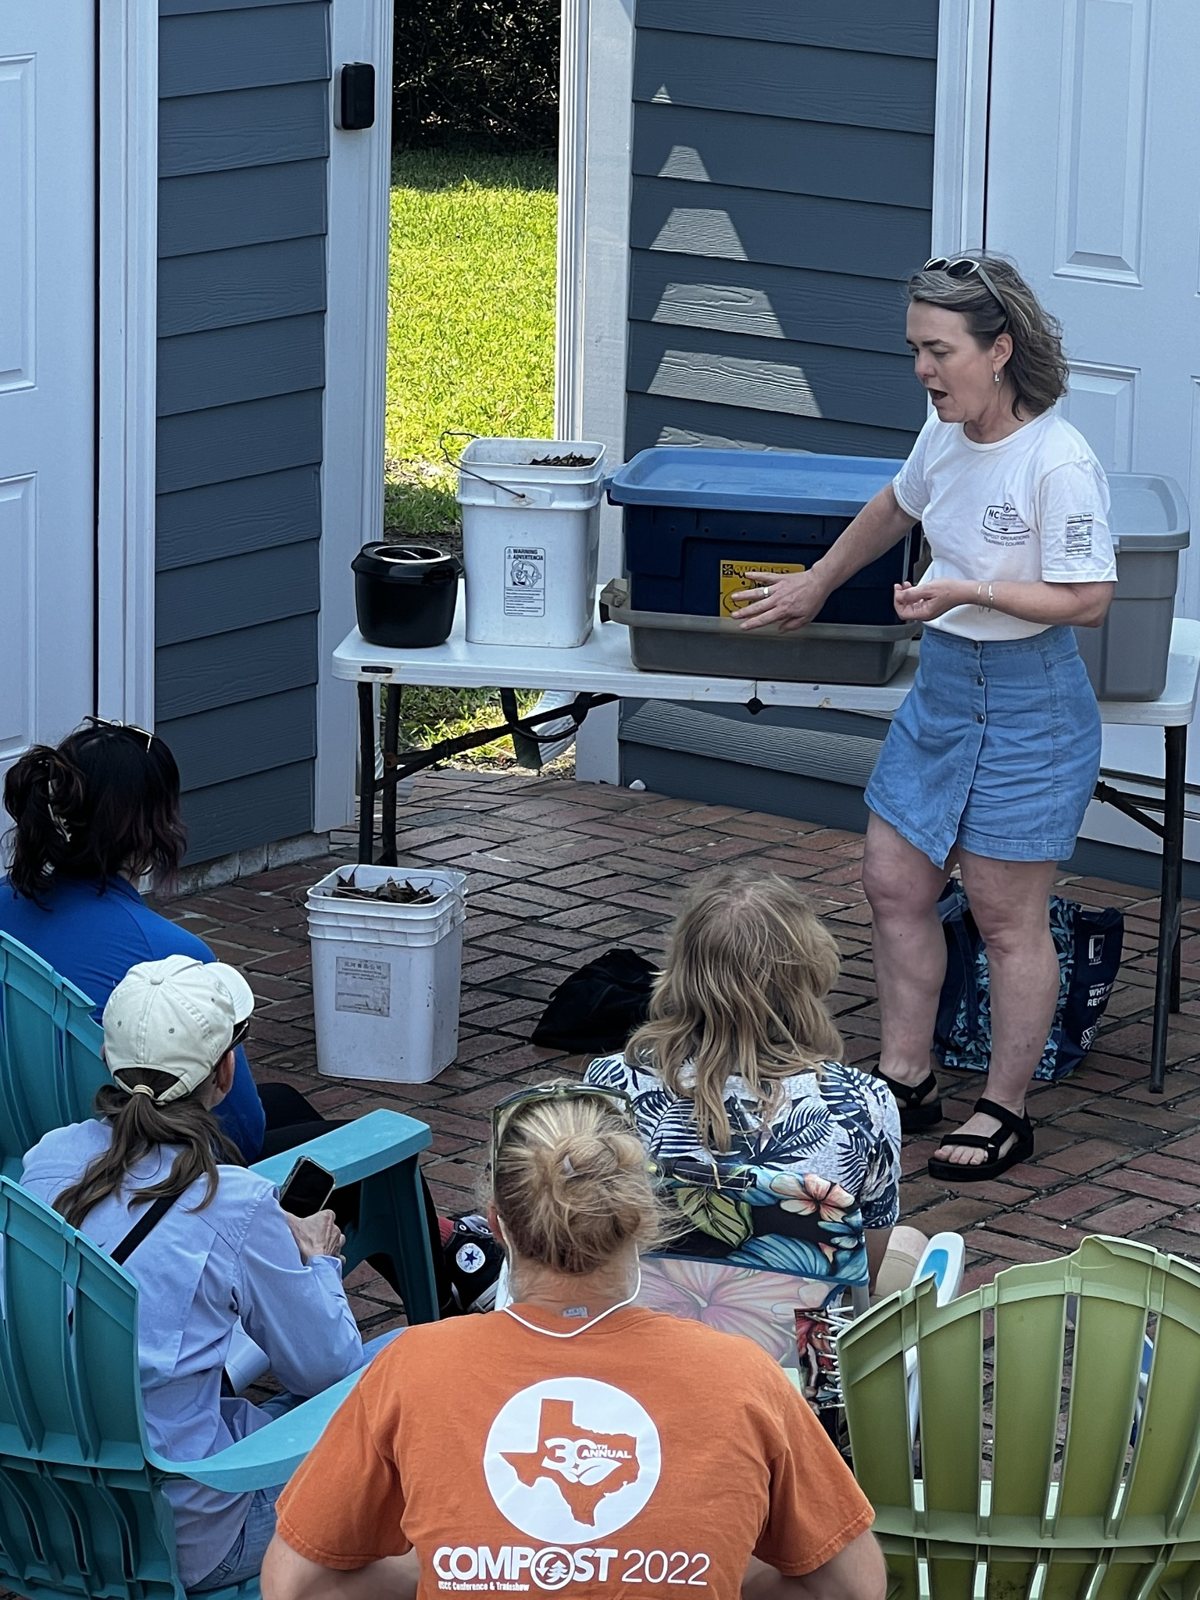
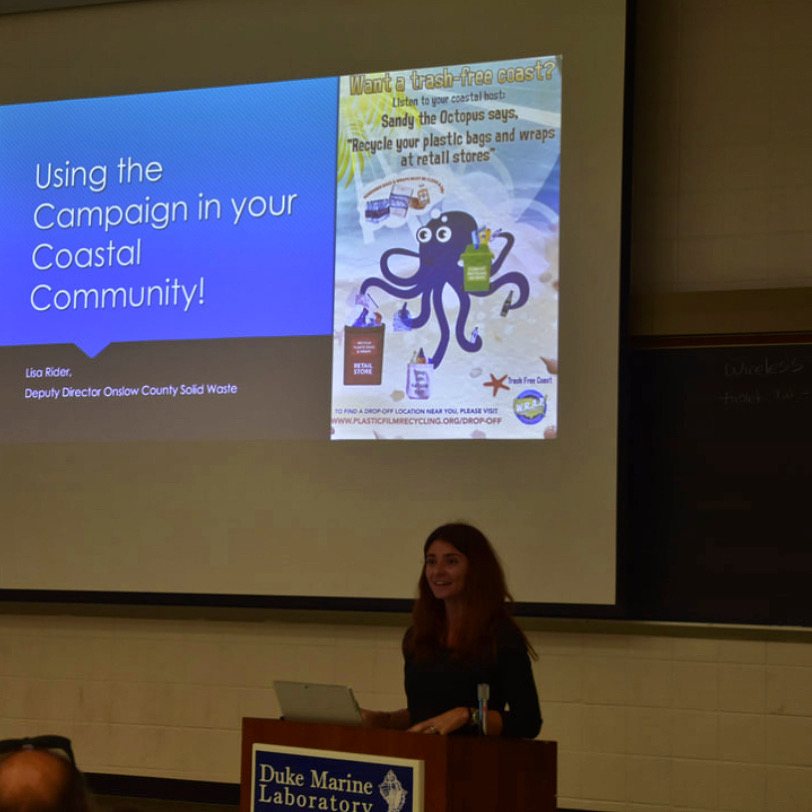

All photographs on this page were taken by Lisa Rider. They illustrate activities and systems; they do not establish a facility’s compliance status or identify a source of contamination.
Explore the Water Quality for Fisheries Symposium · Get involved · Explore plastic pollution
Evidence & further reading
Start with the sources.
This page translates CCRW’s 2026 solid-waste assessment and campaign materials for public use. Key report figures were checked against the primary sources below on October 27, 2026. Historical reporting categories differ, annual capacity estimates are conditional, and modeled policy outcomes are not observed results.
- NCDEQ annual report to the General Assembly, April 2026 — FY 2024–25 disposal, capacity, recovery, and program data. See the solid-waste chapter and facility appendices.
- 2025 North Carolina Waste Characterization Study, published March 2026 — RRS for NCDEQ; see residential and combined composition results.
- NCDEQ: Waste Management Work on Emerging Compounds — PFAS sampling and response information.
- State Auditor: Pre-Regulatory Landfill Program, July 13, 2026 — inventory and monitoring findings.
- NCDEQ Recycling Works: value of recyclables still going to landfill — estimated material value, tipping fees, and airspace implications.
- North Carolina landfill disposal bans and battery guidance.
- Walsh & Woods (2023): PFAS in landfill-adjacent surface waters in North Carolina — site-specific observational research.
- Lang and colleagues: national estimate of PFAS release to municipal landfill leachate.
- Cline and colleagues (2020): material densities for landfill airspace estimates.
- NCDEQ annual-report archive and state planning resources.